

How MariaDB 11.8 became about 3× faster on some in-memory workloads, fixing a regression dating back to 10.5

Publishing on behalf of Alessandro Vetere.
Conclusions first: InnoDB in-memory workloads started paying for LRU management in 10.5, a performance regression, and I think the reason is that a clock, which was meant to say “eviction has started”, began ticking much earlier. A minimal fix would bring back the old meaning of the clock. The fix that we pushed tries to do more: it takes buf_pool.mutex out of the LRU promotion on a page access, not only for in-memory workloads. On one of Mark Callaghan’s tests, 11.8 went from 20,326 to 57,052 QPS (about 2.8 times) with a review revision of the fix. Jonathan “Jeb” Miller validated the merged fix independently on a second host, with even larger gains on 11.8, 12.3 and 13.1. On both hosts, 11.8 with the fix is ≈7–9% faster than 10.4.34.
One buffer pool to rule them all
The buffer pool is the InnoDB cache of pages in memory, and its LRU (least recently used) list decides which page to evict when a free page is needed. In MariaDB 10.5, Marko Mäkelä removed the multiple InnoDB buffer pool instances (MDEV-15058). The innodb_buffer_pool_instances partitioning came from MySQL 5.5, to split the buffer pool mutex, but other fixes had reduced that contention since then. Marko’s point was:
partitioning or splitting mutexes often seems to be a good idea. But partitioning data structures or threads might not be.
Axel Schwenke tested it for a long time, on Intel and ARM, and the results were mixed: depending on the workload and on where the data was, 1 or 4 instances was the best. In the end, Marko concluded: “In most cases, a single buffer pool performed at least as well as multiple ones.” He also wrote down the expectation for in-memory workloads: “If the workload mostly fits in the buffer pool, then there should not be that much load on the buffer pool.” So, from 10.5, there is one buf_pool.LRU list and one buf_pool.mutex that protects it, for the whole server. Let’s keep that expectation in mind.
The side effect found by Mark
Mark Callaghan runs sysbench on every MariaDB release, and he keeps all the results and scripts public in mdcallag/mytools. In 2024 he opened MDEV-33966: with some concurrency, several sysbench microbenchmarks were slower than in older releases. For some read-only ones the drop came in 10.5 (for example, ≈24% for points-covered-pk.pre on a 2-socket server), and the Poor Man’s Profiler (PMP) stacks were pointing to one place:
futex_wait,__GI___lll_lock_wait,___pthread_mutex_lock,inline_mysql_mutex_lock,
buf_page_make_young,buf_page_make_young_if_needed,buf_page_get_low,...
buf_page_make_young() moves a page to the most recently used end of the LRU list (for a page in the “old” sublist, into the “young” sublist), so that a hot page is not evicted. To do it, it takes buf_pool.mutex.
Marko proposed a lazy approach (PR #3522): at page access, only set an ACCESSED flag in the block descriptor, with no mutex; later, the threads that already hold buf_pool.mutex for flushing or eviction move the flagged blocks. But in a simple oltp_read_only with a 1 GiB buffer pool and several GiB of data the patch was slower (264k TPS against 277k), and Marko’s hypothesis was that the approximated LRU evicted pages that were used too recently. So the work stopped there for a while.
Then, in late 2025, Mark opened MDEV-37992: a SELECT with a 100-value IN-list on the primary key, 8 tables of 10M rows, 40 threads, 48 cores.
| Version | QPS |
|---|---|
| 10.4.34 | 73,106 |
| 10.5.29 | 29,832 |
| 10.7.8 | 29,104 |
| 10.8.8 | 76,104 |
| 10.9.8 | 27,182 |
| 11.8.3 | 26,044 |
| 12.1.1 | 25,916 |
About 35–40% of the 10.4 throughput from 10.5 on, with one strange exception: 10.8.8. Context switches per query were about 14.7 times higher in 10.9.8 than in 10.8.8. Roman Nozdrin suggested that I take this dive, with one question: does 10.8.8 disprove that the single buffer pool instance is the root cause?
Checking Mark’s data first
Before building anything, I went through Mark’s archive for that run: 27 releases, same host, nearly the same configuration, with SHOW GLOBAL VARIABLES and SHOW ENGINE INNODB STATUS for each run.
Why was 10.4.34 fast? In 10.4, buf_page_peek_if_too_old() starts with:
if (buf_pool->freed_page_clock == 0) {
	/* If eviction has not started yet, do not update the
	statistics or move blocks in the LRU list.  This is
	either the warm-up phase or an in-memory workload. */
	return(FALSE);
}
// ...
The buffer pool was 100 GiB and the data about 19 GiB, so this should be “an in-memory workload”. freed_page_clock moves only when a page is removed from the LRU list, and in this workload that seems to happen only on a shortage of free blocks, which never came (5.1M of 6.4M frames were still free at the end). The I/O sum counters, which are filled only with a non-zero clock, confirm it: 0 in all the pre-10.5 runs. So, it seems 10.4 was not “fast at LRU management”: it was just not promoting any block.
Why did 10.5+ change this? MDEV-15528 (10.5.2) and MDEV-8139 (in 10.5.4, but enabled only from 10.5.5) changed how freed pages are handled, with a good intention: InnoDB no longer writes freed garbage back to the data files, and the FREE_PAGE redo log record lets recovery avoid unnecessary work on freed pages. But, as a side effect, when purge frees an undo page, or a B-tree page is freed, the page cleaner now removes it from the LRU list, and so ticks the clock. It seems the load phase is enough to arm it: with Mark’s innodb_max_dirty_pages_pct=1 the page cleaner keeps writing, so it soon releases a freed page, and the clock leaves 0 and never goes back. Mark’s range-notcovered-si.pre test seems to confirm it: it runs after the load and before any write test, and it already has about half of the 10.4.34 throughput in 10.5.6. Pages made young in Mark’s status output (counted from server start) goes from about 25 thousand (10.4.34) to 1.3–1.8 billion (most 10.5+ releases). On the MDEV-37992 test the cost came in two steps: 10.5.6 already lost about 40%, and when MDEV-23399 made buf_pool.mutex a blocking mutex, the context switches per query went from 2.8 to 29.6.
Why did 10.8.8 restore the performance? 10.8.8 is the only release in the set with MDEV-30671 but without its fix MDEV-31234, which leaked undo pages. Its status shows 3,584 free buffers, against 5.2M in 10.7.8 and 10.9.8: the buffer pool was full. A full buffer pool has a young sublist of about 4M frames, more than three times the hot set, so I inferred that the hot pages were already in the young sublist and almost never needed a promotion. So I think 10.8.8 was fast by accident. It does not disprove the single instance theory, but it suggests that the cost is in the promotion: one instance seems to make each promotion more expensive, but in these in-memory runs the promotions themselves started in 10.5.
Why did 10.9.8 pay a context switch every three rows? Mark also runs random-points, which is like the MDEV-37992 query but selects c instead of id (SELECT c FROM sbtest WHERE id IN (...)), with 10, 100 and 1,000 values. Against 10.4.34, the extra context switches per looked-up row in 10.9.8 were 0.333, 0.340 and 0.337, flat, and the old sublist was 37% of the LRU list (≈7% of the pool). That is consistent with one blocking mutex acquisition for nearly every touch of an old page, paid with an 80% empty buffer pool.
Testing
Reading the data gives a theory, so I wanted to see it on a running server. I wrote a script that builds three variants of the same tree and runs Mark’s oltp_points_covered.lua with his configuration, after a short write phase (oltp_read_write.lua) in the same server, to arm the clock as Mark’s load and write tests do:
base: the unmodified tree;gate:buf_page_peek_if_too_old()always returnsfalse;clock:freed_page_clocknever advances.
On the main branch (81b908dc0ea), on a 2 × Xeon Gold 6230R machine, datadir on /dev/shm (all settings in MDEV-37992), median of 3 runs, with the pages made young counted only during the measured run:
| variant | QPS | p95 (ms) | pages made young |
|---|---|---|---|
| base | 18,945 | 2.66 | 112,436,741 |
| gate | 57,286 | 0.99 | 0 |
| clock | 56,935 | 0.99 | 0 |
The same two hacks on 10.4.34 change little (at most ≈3%, which seems to be noise): there the gate was already shut.
The same effect is possible with no rebuild: innodb_old_blocks_time is the time that must pass after the first access to an old page before it can be promoted, and with a huge value (2147483647 ms, about 24 days) in these short runs no old page is promoted. base with this “hack” got 55,598 QPS against 19,373.
The alternatives
There were three ways forward:
- Restore the meaning of the clock, as in 10.4: let
freed_page_clocktick only when a page is evicted. This is the minimal fix, and it should give back at least the 10.4 numbers for in-memory workloads. - Tell users to set
innodb_old_blocks_timeto a huge value. No code change, but then old pages are practically never promoted: pages read from disk enter the old sublist and stay there, so they are evicted like the pages of a scan, even when they are hot. It can be a workaround on releases without the fix, but only when the data fits in the buffer pool. - Make the LRU management itself cheaper, continuing Marko’s lazy approach, with the risk that he suspected: an approximated LRU may evict hot pages.
I think option 1 would not go far, for three reasons. First, the clock is monotonic: one spike of the data set beyond the buffer pool arms the LRU management until the next restart, also in 10.4. Second, when the workload does not fit in memory, we would be back at one global mutex acquisition per old-page touch, and the original MDEV-33966 problem would stay untouched. Third, no promotion until the first eviction means a FIFO order during warm-up, so when eviction starts, the hot pages may not be where they should be (but this is speculation).
I also looked at how PostgreSQL chooses an eviction candidate. There is no exact LRU list: each buffer has a small usage_count, incremented on access with a CAS and decremented by the clock-sweep that looks for a victim. The cost of the “recency” decision moves from the access to the eviction: the same direction as Marko’s idea. So I went for option 3.
Polishing MDEV-33966
I continued Marko’s work in PR #5763, and I am co-author of the pushed commit. The basic split stays:
- access time (
buf_page_t::touch()): no mutex, the access stores the time of the first access, and sets aPROMOTEbit (with an atomic OR) if the block qualifies for promotion; - sweep time (page cleaner, LRU eviction, flush-list batches): these already hold
buf_pool.mutex, so they move thePROMOTEblocks to the most recently used end, and refresh their access time. When few sweeps run, as in an in-memory read-only workload, most blocks just keep the bit until a sweep comes.
What changed is when the decision is made and which clock is used.
The decision is made at access time, and it is sticky. In the first version the sweep decided, but a sweep can reach a block long after a table scan touched it in one burst, and then the burst looks like a “re-access”, and the scanned page is promoted. Now the innodb_old_blocks_time rule is applied at access, at any position in the list: the block qualifies only if accessed again at least innodb_old_blocks_time after its first access (or its last promotion). This should keep the scan resistance of the original InnoDB LRU. This is why the bit is now PROMOTE and not ACCESSED: it records the decision, not only the access, so a sweep that comes long after a table scan does not take the accesses of the scan for a re-access (only the move comes later, at sweep time). The LRU order is an approximation, but keeping the rule was important because the fix goes into 11.8 and 12.3, which are LTS series.
A new clock instead of freed_page_clock. freed_page_clock is removed. buf_pool.access_clock is a 16-bit second counter, refreshed by a background timer, so a page access never reads the system clock. So innodb_old_blocks_time now has a resolution of one second (a value is rounded up), and the value used internally is capped at ≈18.2 hours. The age of a block is computed modulo 65,536 seconds (≈18.2 hours), where before the fix it was modulo 2³² milliseconds (≈49.7 days): with the default of 1 second the wrap makes almost no difference, but with a value close to the cap, an old block qualifies for promotion only when it is accessed again in a short window every ≈18.2 hours, instead of every ≈49.7 days. Because the rule no longer depends on “eviction has started”, the approximated LRU management also runs during warm-up: when eviction begins, the hot pages should already be young or carry the PROMOTE bit, so the eviction scan moves them instead of evicting them.
Different sweeps, different jobs. The flush-list batch moves only old blocks, since a young block is not close to eviction yet; the LRU sweeps move every flagged block, and a long run of moves releases buf_pool.mutex every 512 blocks, so it does not block other threads for long.
The block descriptor does not grow, it actually gets 8 bytes smaller, and a new test, innodb.buf_lru_scan_resistance, checks the scan resistance: in a small buffer pool, a table read in one burst is evicted by a later scan, while a table read again after innodb_old_blocks_time stays.
So, why do I think it’s more than a minimal fix? Because it removes buf_pool.mutex from the LRU promotion on a page access, even when the workload does not fit in memory, and MDEV-37992 gets fixed as a consequence, without bringing back a special case.
Results
Mark’s oltp_points_covered.lua test, 40 threads, 100 GiB buffer pool, median of 3 runs on the same machine and with the same counters as in the Testing section. All my numbers in this section come from a review revision of PR #5763 (ab4f5dd903b, on top of 11.8 e87b958d2e4), since the code got some more changes in the review after my runs.
| server | QPS | p95 (ms) | pages made young | context switches / query |
|---|---|---|---|---|
| 10.4.34 | 52,410 | 0.92 | 0 | 1.07 |
| 11.8 before the fix | 20,326 | 2.52 | 119,554,561 | 28.8 |
| 11.8 with the fix | 57,052 | 0.95 | 338,335 | 1.16 |
The drop in pages made young does not mean that hot pages missed promotion: here there is no eviction and few sweeps run, so most flagged blocks keep the bit and wait, and further accesses to a flagged block do not count again.
In MDEV-37992 I expected at least some regression against 10.4.34, which promoted no block here. Instead, on this test the fix is ≈9% faster, and it still does (approximated) LRU management. The gate variant in the Testing section, which promotes no block, got about the same QPS on main, so I think the gain against 10.4.34 comes from other changes after 10.4, not from the LRU. Some other tests of Mark’s set also improved: random-points (range=1000) from ≈1,900 to ≈5,800 QPS, range-notcovered-si (range=100) from ≈19,100 to ≈59,500 QPS. The update-index test shows no regression (it seems the bottleneck is elsewhere), and its pages made young go from about 8.7M to 1.4M, but this is only an indication of less LRU churn, since the counter is now incremented at sweep time.
And Marko’s concern, the eviction of hot pages? I repeated the oltp_read_only workload where the first version regressed (5 GiB of data, 1 GiB buffer pool), this time on my laptop (Core Ultra 7 155H). The hit ratio was 98.8% with the fix against 98.7% before with a Pareto key distribution, and 95.8% for both with a uniform one. The throughput did not drop either (13,466 against 11,971 TPS with Pareto, about the same with uniform), but the laptop runs are noisy, up to ≈14% between runs. So, at least in these tests, the approximation doesn’t seem to lose hot pages.
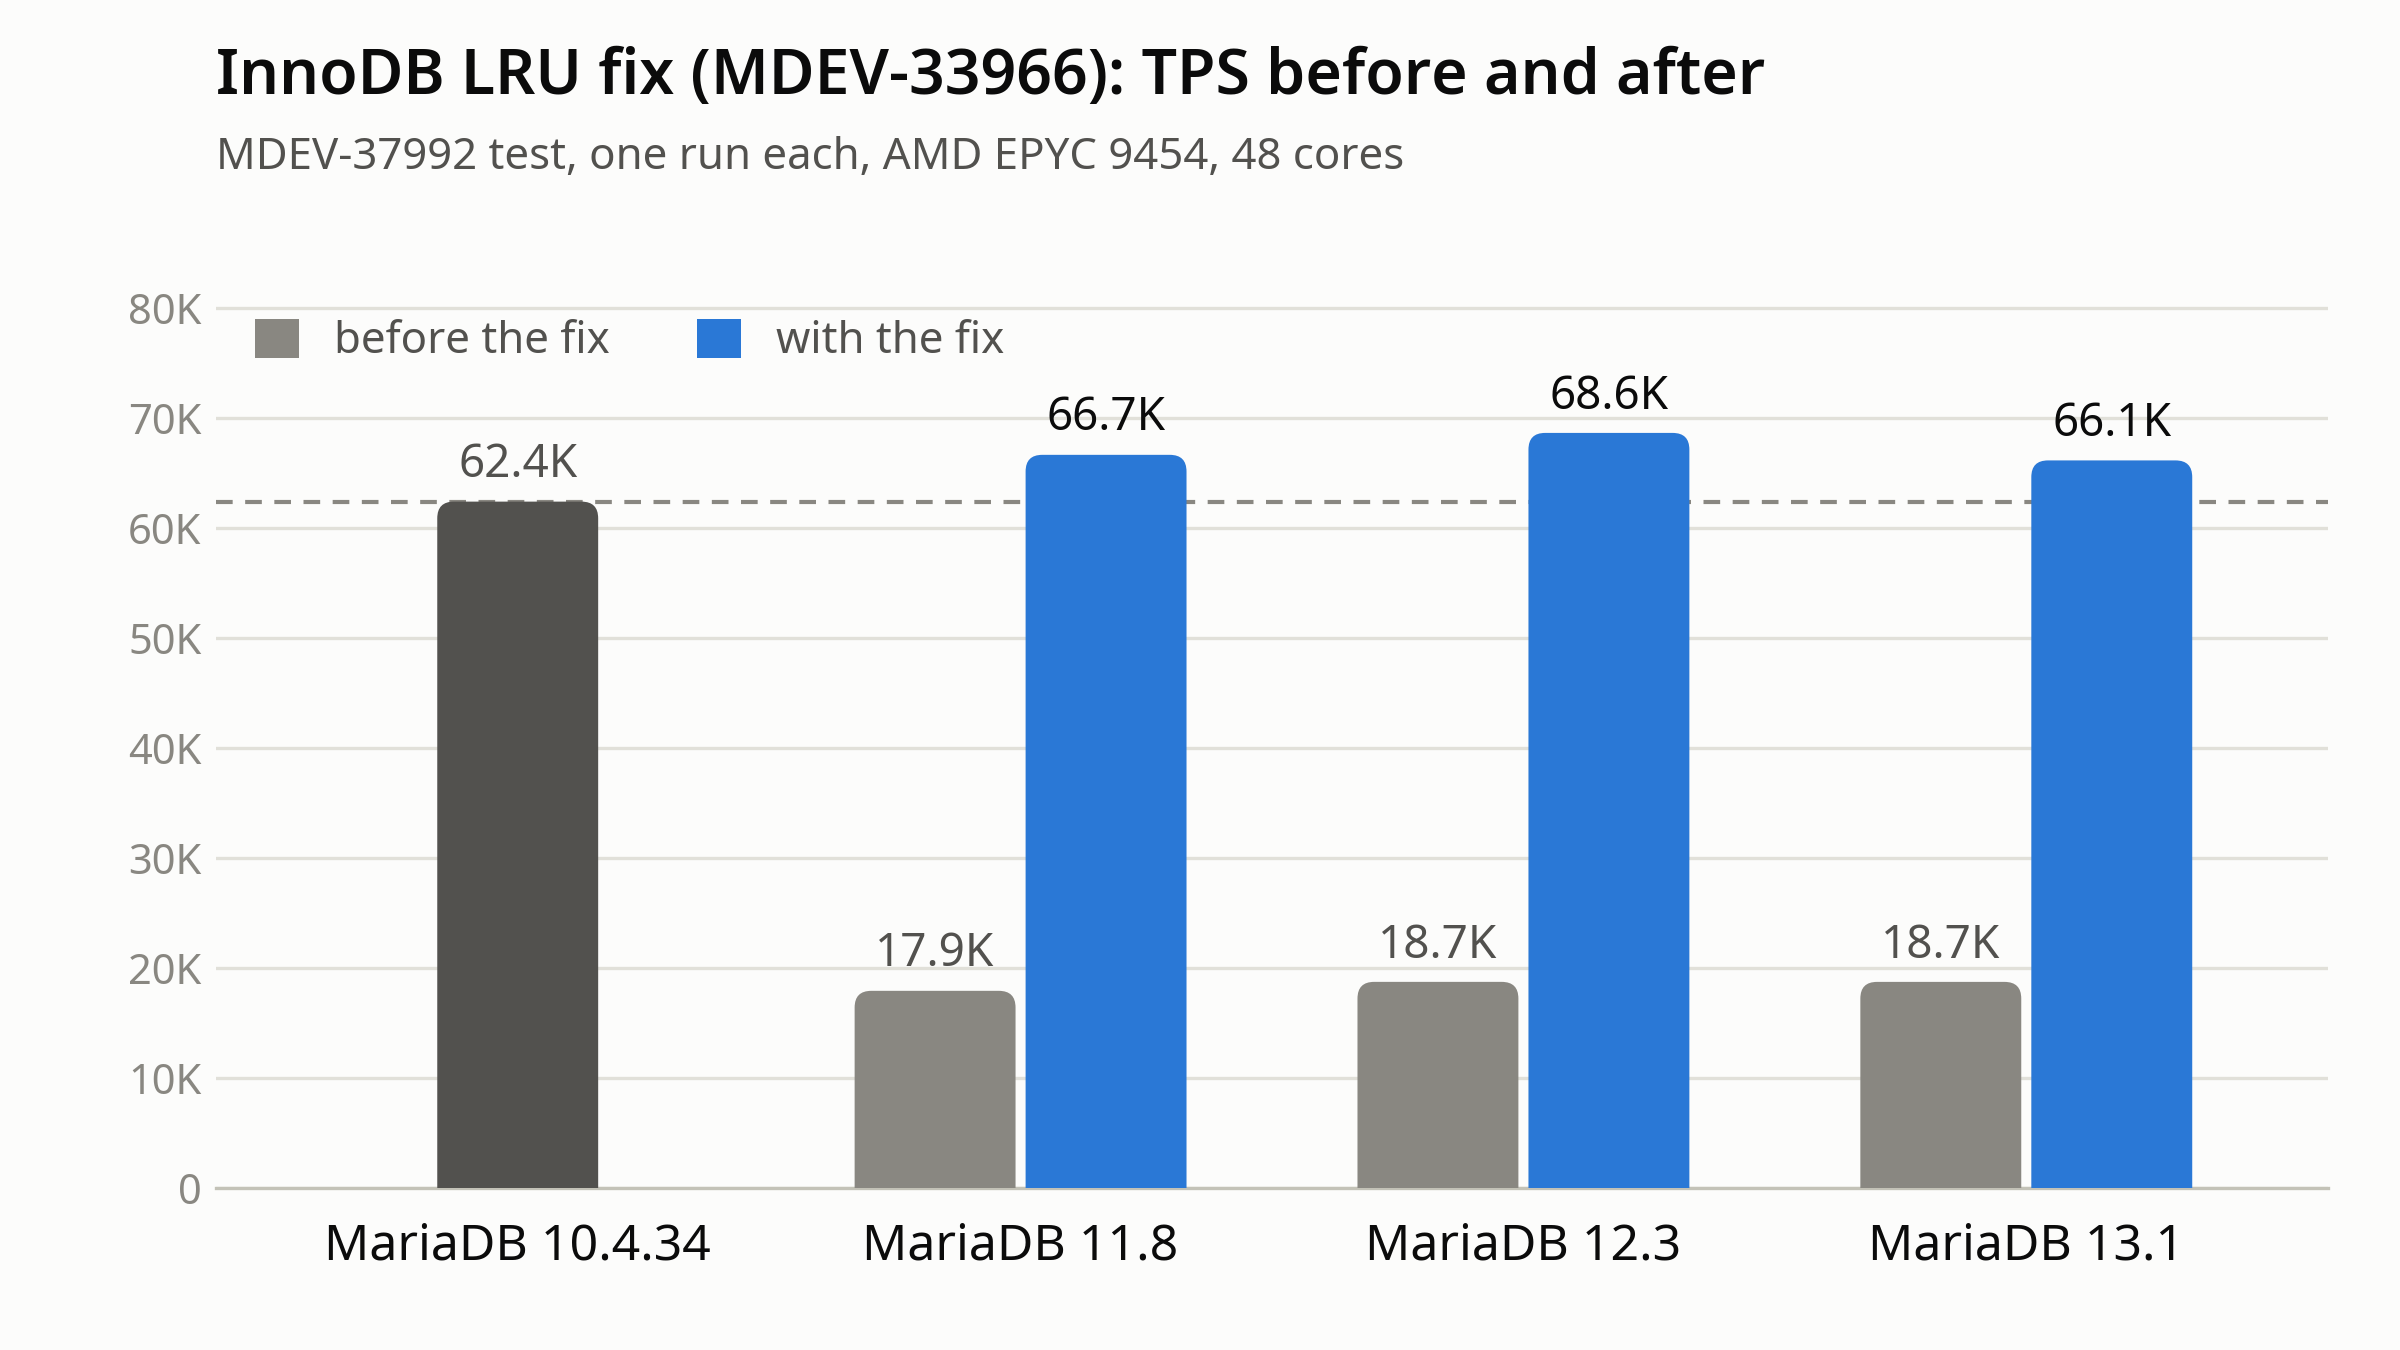
Jeb verified the pushed commits independently on a Hetzner sponsor host (AMD EPYC 9454, 48 cores), one run each, and described it in his post. He reports TPS, which in this test is the same as QPS (one query per transaction):
| branch | before | after |
|---|---|---|
| 11.8 | 17,925 TPS | 66,653 TPS |
| 12.3 | 18,740 TPS | 68,646 TPS |
| 13.1 | 18,738 TPS | 66,146 TPS |
On the same host, 10.4.34 got 62,400 TPS.
There is no new option to set: innodb_old_blocks_pct and innodb_old_blocks_time are still the ones that control the LRU, and the FREE_PAGE_CLOCK column in INFORMATION_SCHEMA now always shows 0.
What is next
Because of the LTS series, the change had to keep the LRU behavior that users rely on: the innodb_old_blocks_time rule is kept, a new test checks the scan resistance, and the hit ratio did not drop in the test that does not fit in memory. The next step is to measure HammerDB TPROC-C, an I/O-intensive, mixed read-write workload, which is one more case where the LRU order can have an effect. There, the throughput can also depend on other latches (Marko’s earlier experiments on MDEV-33966 showed lock_sys.latch), so I prefer to wait for the numbers. There may be more to do: one PROMOTE bit is a very coarse “recency” signal, and more bits could record something closer to a usage_count, or other properties of the page, but these bits must fit in buf_block_t, which MDEV-41403 wants to shrink to 128 bytes.
If you have a workload where the buffer pool LRU matters, especially one that does not fit in memory, please try a build of the 11.8, 12.3 or 13.1 branch (or the next releases: 11.8.10, 12.3.4 and 13.1.2) and if you see a regression, please report it in a new MDEV that links to MDEV-33966. Look at Innodb_buffer_pool_read_requests against Innodb_buffer_pool_reads too, not only the throughput, and note that Innodb_buffer_pool_pages_made_young is now counted at sweep time, so it is not directly comparable with older versions.
Thanks
To Mark Callaghan, for the reports and for keeping all his results public: that archive made it possible to dig deeper into this issue. To Marko Mäkelä, for the original idea and patch, and the reviews. To Roman Nozdrin, for pushing me to look at the 10.8.8 anomaly. To Jeb Miller, for the verification, and to Hetzner, for the hardware.
Leave a Reply