

MariaDB Foundation TAF: Profiling MariaDB Subsystems Across Hardware Using Targeted Performance Profiles


MariaDB has a lot of moving parts. Binlog durability, isolation levels, thread scheduling, Performance Schema instrumentation, InnoDB safety mechanisms, charset handling, SSL, logging — each subsystem has its own cost, and that cost changes depending on the hardware underneath it.
Last week we built a structured set of performance profiles to measure those costs directly. The goal wasn’t to tune MariaDB. The goal was to isolate each subsystem and quantify its impact on throughput across different machines.
These profiling configurations were originally proposed by Monty in MDEV‑39497 as a way to isolate the performance cost of individual MariaDB subsystems. We expanded that idea into a full suite of reproducible profiles that can be applied across different hardware to measure binlog overhead, isolation level cost, threadpool behavior, Performance Schema impact, and other subsystem effects.
TAF commit: https://github.com/MariaDB/TAF/commit/20cbeaf1c78178bd4c502fee195f12b4b7267347
Why We Built These Profiles
MariaDB exposes dozens of configuration switches, and many of them have non‑obvious performance implications. Worse, the cost of a given feature isn’t universal — it depends heavily on:
- CPU architecture
- core count
- NUMA layout
- storage type (NVMe vs SATA vs networked)
- filesystem
- memory bandwidth
- network stack
- workload shape
If you want to understand how MariaDB behaves on your hardware, you need a way to flip one switch at a time and measure the effect. That’s what these profiles do.
Step 1: Establishing the Baseline
Before running any subsystem profile, we determine the cached warehouse count for the host. This is a simple but critical step:
- Find the warehouse count that fits entirely in buffer pool
- Avoid buffer pool thrashing
- Avoid IO‑bound behavior
- Maximize repeatability
- Lock in a stable TPS baseline
Every subsystem profile is run against this baseline so results are comparable across hardware.
Step 2: Subsystem‑Specific Profiles
Each profile flips exactly one switch. No combinations, no tuning, no “best practices.” Just one subsystem at a time.
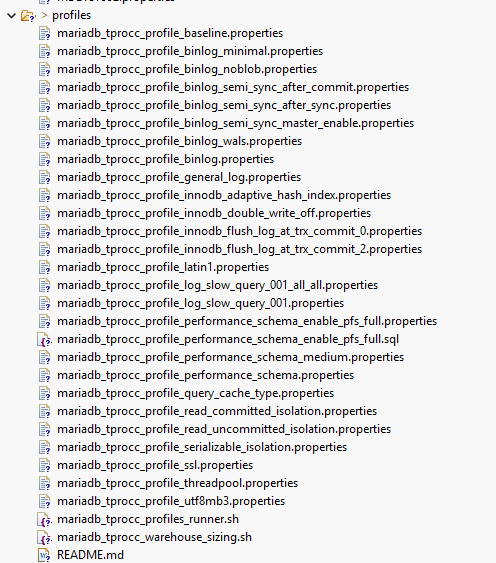
Binlog Profiles
Measure the cost of durability and replication guarantees.
- binlog on/off
- minimal binlog
- no‑blob binlog
- semi‑sync (after commit / master enable)
- WAL binlog
InnoDB Behavior Profiles
Measure the cost of internal safety and concurrency mechanisms.
- doublewrite off
- adaptive hash index on/off
- flush log at trx commit = 0
- flush log at trx commit = 2
- isolation levels (RU, RC, Serializable)
Performance Schema Profiles
Measure instrumentation overhead.
- PFS minimal
- PFS medium
- PFS full
- PFS full SQL initializer
Threadpool Profile
Measure MariaDB’s threadpool scheduler vs OS thread scheduling.
Charset Profiles
Measure CPU cost of character set conversion.
- latin1
- utf8mb3
Logging Profiles
Measure diagnostic logging overhead.
- general log
- slow query log (various granularities)
SSL Profile
Measure encrypted connection overhead.
Step 3: Running the Profiles Across Hardware
Once the baseline is established, each profile is executed against the same workload and warehouse count. This gives us a clean, comparable set of numbers:
What This Gives Us
This profiling suite gives us:
- A repeatable way to measure subsystem cost
- Hardware‑aware performance insights
- A clean separation between “MariaDB overhead” and “hardware limitations”
- A way to compare machines objectively
- A foundation for future tuning work
- A way to validate regressions across versions
It’s simple, structured, and designed to answer one question at a time.
At the end of the day
At the end of the day, this profiling suite gives us something we’ve needed for a long time: a repeatable, hardware‑aware way to see what MariaDB is actually doing. It cuts through noise, exposes real subsystem cost, and gives us a reliable baseline for every machine and every version going forward. No guesswork. No hand‑waving. Just data we can trust — and a framework that keeps us honest.
Everything shown here — the baseline, the subsystem profiles, the hardware comparisons — is fully reproducible. The complete suite (profiles, runner scripts, warehouse sizing tools, and TAF integration examples) is documented in the repository’s README.md.
To all “Happy benchmarking!”
Jonathan (Jeb) Miller has experience in military leadership, Fire/EMS leadership, computer operations leadership, teaching, and more than 27 years of database performance engineering (PervasiveSQL, MySQL, MariaDB).
TAF is the third benchmarking framework he has helped design and build.
#MariaDB #MySQL #PostgreSQL #Database #TAF #DatabasePerformance #Performance
Leave a Reply