
Generating MariaDB Metrics
Something that is very important to us in the MariaDB Foundation is “Openness”. This is not only in the open source nature of MariaDB, but we are also very transparent in what happens with the MariaDB source code. With that in mind we have been working on ways to generate metrics that show information about the community in a consumable form.
As with everything we do the scripts to generate these metrics are completely open to the public so that they are available to scrutiny and pull requests for improvements. The general idea is these scripts will consume information from various places, such as GitHub and supply CSV files which can be imported into anything (even a MariaDB database) and used to generate any required report. We will also be generating public reports based on this data.
Pull request metrics
The scripts are all housed in a GitHub repo (https://github.com/MariaDB/metrics) which you can go in and view, change and use as needed. At the moment there are two sets of scripts. The first is in the “pull-requests” directory. This talks to the GitHub REST API to retrieve a week-by-week breakdown of the open/close pull request counts for MariaDB server.
It generates CSV output that looks like this:
Week Ending,New PRs,Closed PRs,Merged PRs,Total PRs,Still Open PRs
2022-01-09,3,1,4,1973,80
2022-01-16,3,1,1,1976,81
2022-01-23,9,6,4,1985,80
2022-01-30,6,7,2,1991,77
In turn we can pop this into a graphing or visualisation tool such as matplotlib and get a visual representation. With this data we can see trends such as this one showing that unfortunately our open pull request count is quite high right now.
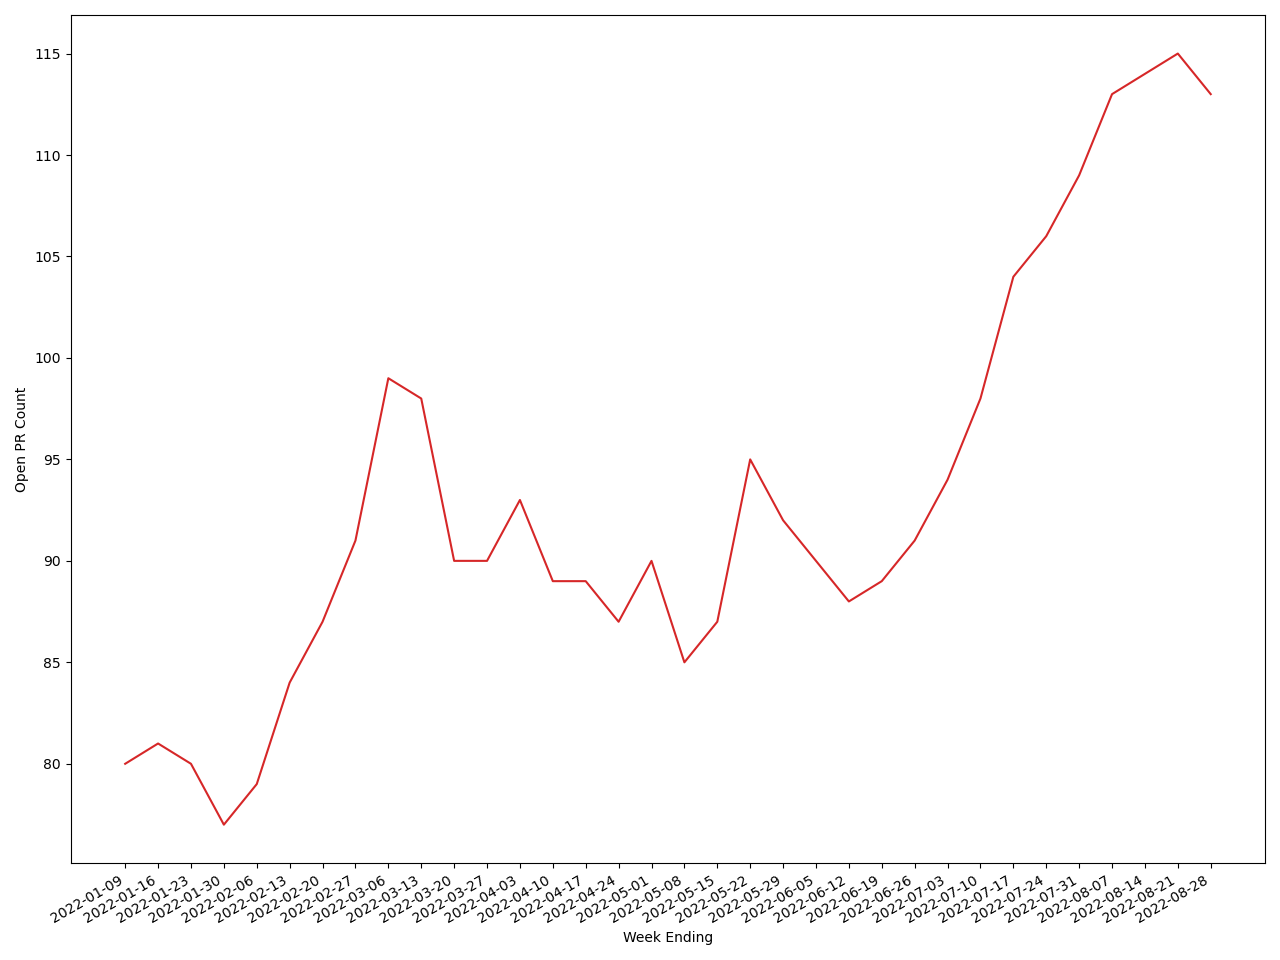
Part of my job is to bring this back down, but this won’t be an overnight thing. I’m not going to go into every stale pull request and immediately close them. I’d rather work with the contributors and MariaDB engineers to come to a resolution with each pull request. But visualisations such as this helps us benchmark our own performance on this and other things so that we can take appropriate action.
Commit metrics
In addition to this we have a “commits” directory which uses an existing open source tool called Gitdm (Git data miner) to dive into the git history and generate reports on it. Gitdm was originally designed to be used against the Linux kernel git tree, so we have made a few changes to this to make the reports more useful to us but in general we were getting good results out of the box.
Gitdm uses a set of basic configuration files to help identify the affiliation of contributors when their email address in the git log is not easy to identify. The output of the tools used here are CSV files for individual contributor counts and organisation counts over a given time period. It also generates a human-readable text representation at the same time.
This allows us to turn the output CSV looking like this for the organisations output:
Name,Commits,Lines Added,Lines Removed
"Amazon",27,985,338
"MariaDB Corporation",3218,793570,297867
"Atos",1,12,1
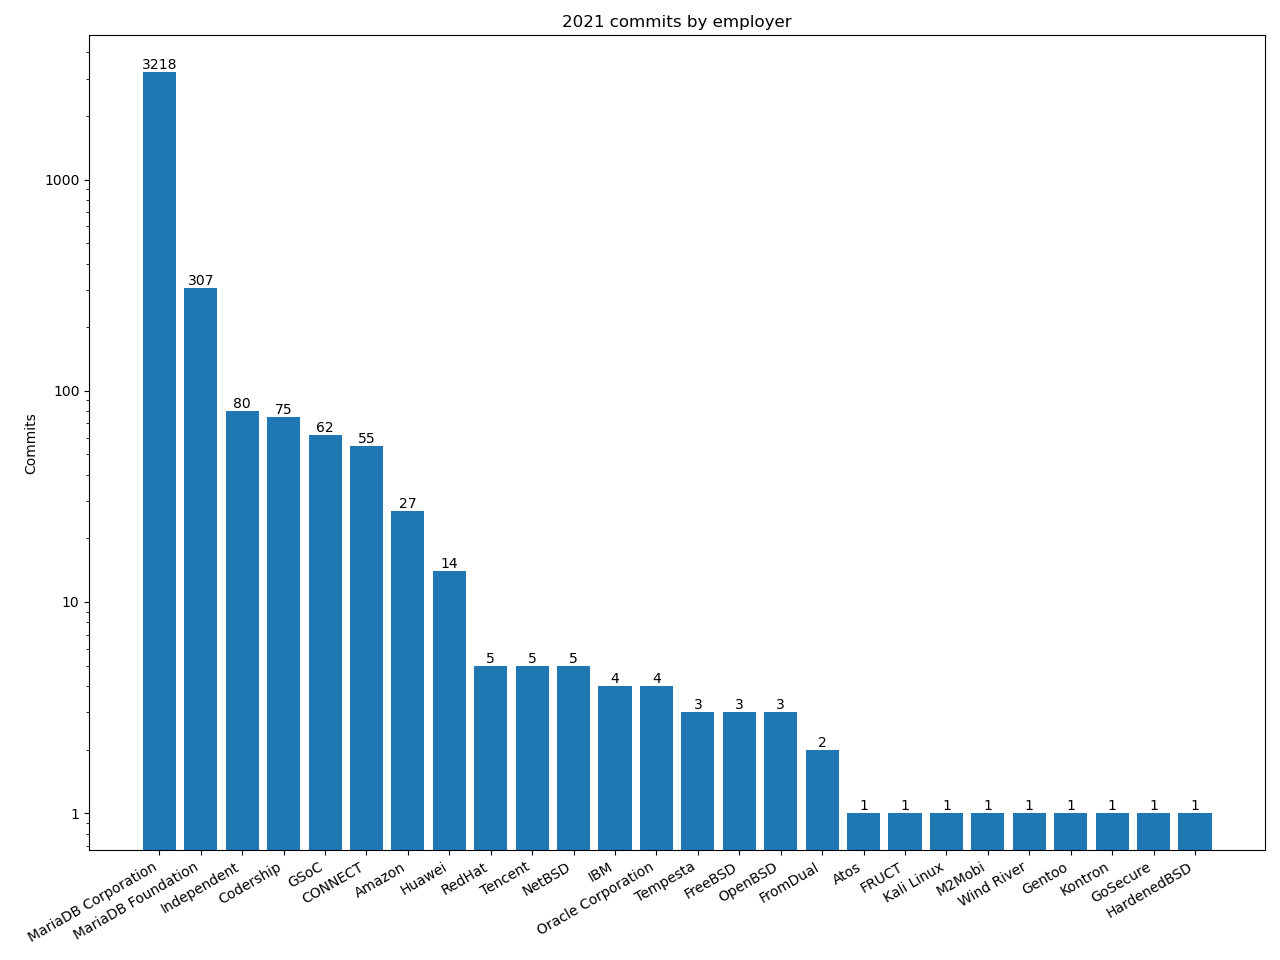
"Codership",75,16857,6308Into graphs such as this:
Visualisation ideas
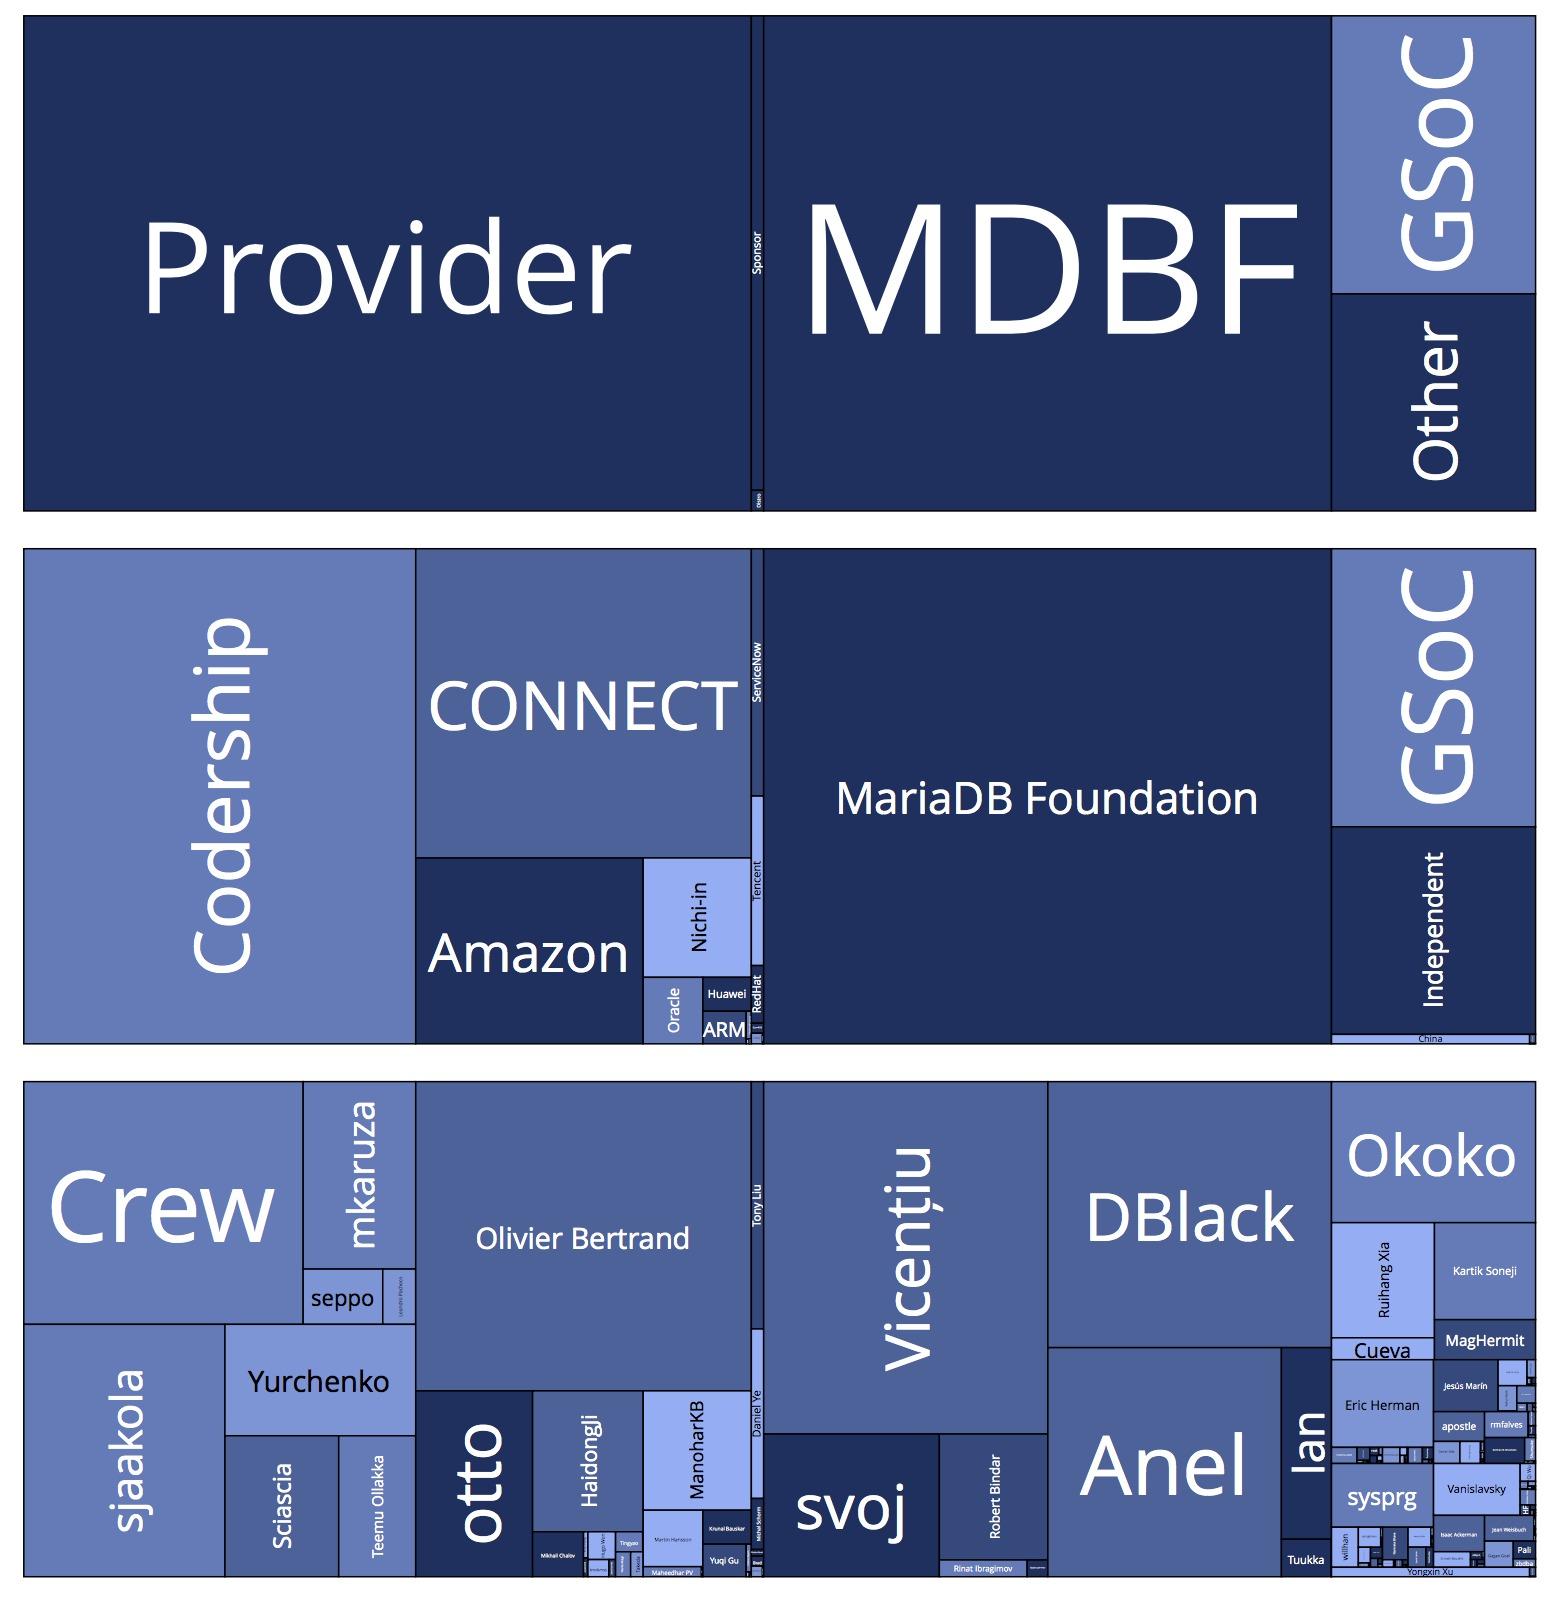
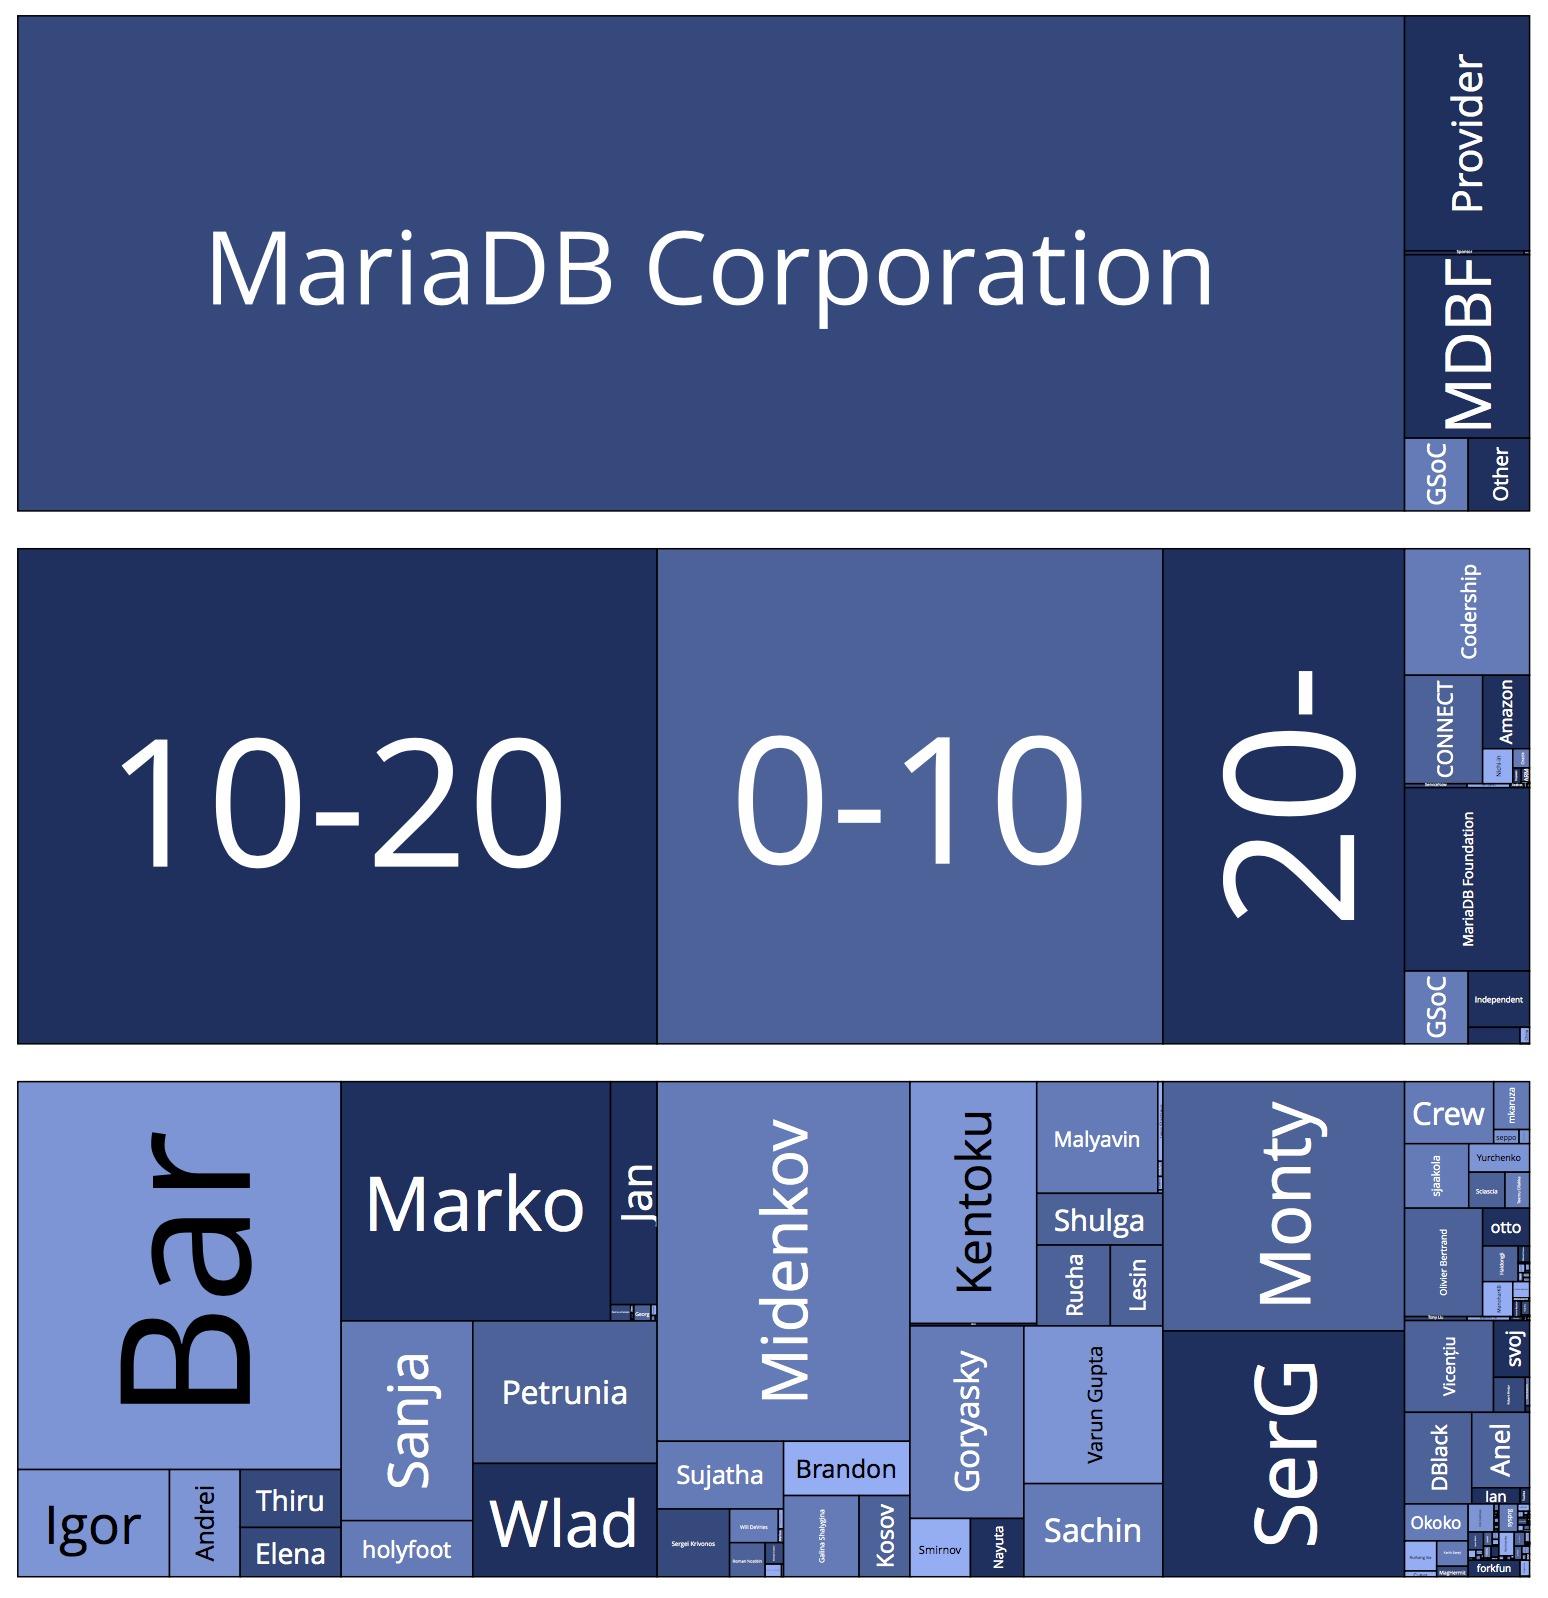
Our CEO, Kaj, has been creating some very interesting visualisations from the data based on the work of George Voronoy. This one for example shows the contributing organisations at the top, a representation of length of tenure for MariaDB Corporation contributors and individual contributors at the bottom. The darker the colour the higher the ratio of lines removed vs added in commits.
Over time we will be automating as much of this as we can, generating data from more sources and making the generated data easily available, not just the scripts that generate it.
As part of the May 2022 MariaDB Foundation board meeting one of the things requested was a breakdown of contributions into categories as well “a) Financial sponsor, b) Non-sponsor, c) Foundation employee”. At the time of writing this post we have not fully automated this breakdown, but we have created another visualisation, manually adding the categories, showing what these kind of categorisations could look like.
We are also very interested in learning what data about the MariaDB code and community you would like to see visualised, and what kind of groupings / categories you would like to see contributors in. This does lead me to…
We need your help
I’ve said this a lot over the years and it probably applies even more now for this role, “a contribution is more than just code”. Trying the software out and giving feedback or bug report is a contribution, helping with community questions count as contributions, there are a lot of things that fall under this banner.
For this project we need your help to identify the organisations the contributors are contributing for. A few of us in the MariaDB Foundation have made attempts at this, but we think there are quite a few people that have done their work for various entities instead of as an independent contributor.
If you could go to the “employers” file in our gitdm configuration and open any pull requests for mistakes you observe that will help us immensely to generate even more accurate data.
Hello Andrew
Do you also want to write something about the MariaDB Contributor Agreement (MCA) (https://mariadb.com/kb/en/mca/)?
GPLv2 does NOT require it. Open Source does NOT require it. For me it is a no-go to sign it. And thus a no-go to contribute anything…
OK. I also would not be capable to contribute C/C++ code…
BR, Oli
Hello Oli,
There are discussions about the MCA and how it is handled going on in the background, with the intention of making the whole process smoother. You do not need to sign the MCA if you do not wish to, there is an alternative method which others use which is to contribute under the 3-Clause BSD.
As for not being capable of contributing C/C++ code, that is completely OK. Contributions come in many forms, not just code for the server. Anything that helps the community is a contribution, that includes documentation, scripts, examples or just helping a community member out who is stuck on a problem.
I hope this helps. Feel free to email me if you want to discuss licensing further.
Kind Regards
Andrew
One more metric: Number of contributors in general and contributors per employer.
I think this would help in painting a picture on how many people overall are working on improving the code base, and also how many people from different organizations participate.
Hi Otto,
That is a good idea, many thanks! I’ll see if I can get it into the next report.