
In a previous blog post, I gave an overview of the CloudFest Hackathon. At this event my team created a plugin for WordPress which added additional health checks for MariaDB. Since the Hackathon we have managed to get this plugin into the official WordPress plugin repository and are working on improving it.
About the plugin
The plugin is designed in a modular way with multiple parts that can be useful for WordPress administrators. The following is a breakdown of all the parts currently in the plugin.
Metrics
One of the core features is gathering metrics about the queries executed. At the moment it collects average query execution time and number of database queries executed. This is done using a wrapper around the WPDB class in WordPress to add a hook at the end of the query execution. The down side of this is a few queries are missed prior to the plugin being loaded during execution. But it does mean we do not have to modify WordPress’s source code to capture this data. It also means we don’t have to use WordPress’s “SAVEQUERIES” debugging mode which, whilst gathering the same data, can significantly increase execution time.
Inside the dashboard you can find this data charted for the last 24 hours. This can be useful to spot things such as any significant changes a new plugin makes to your database usage, and potentially execution / load times.
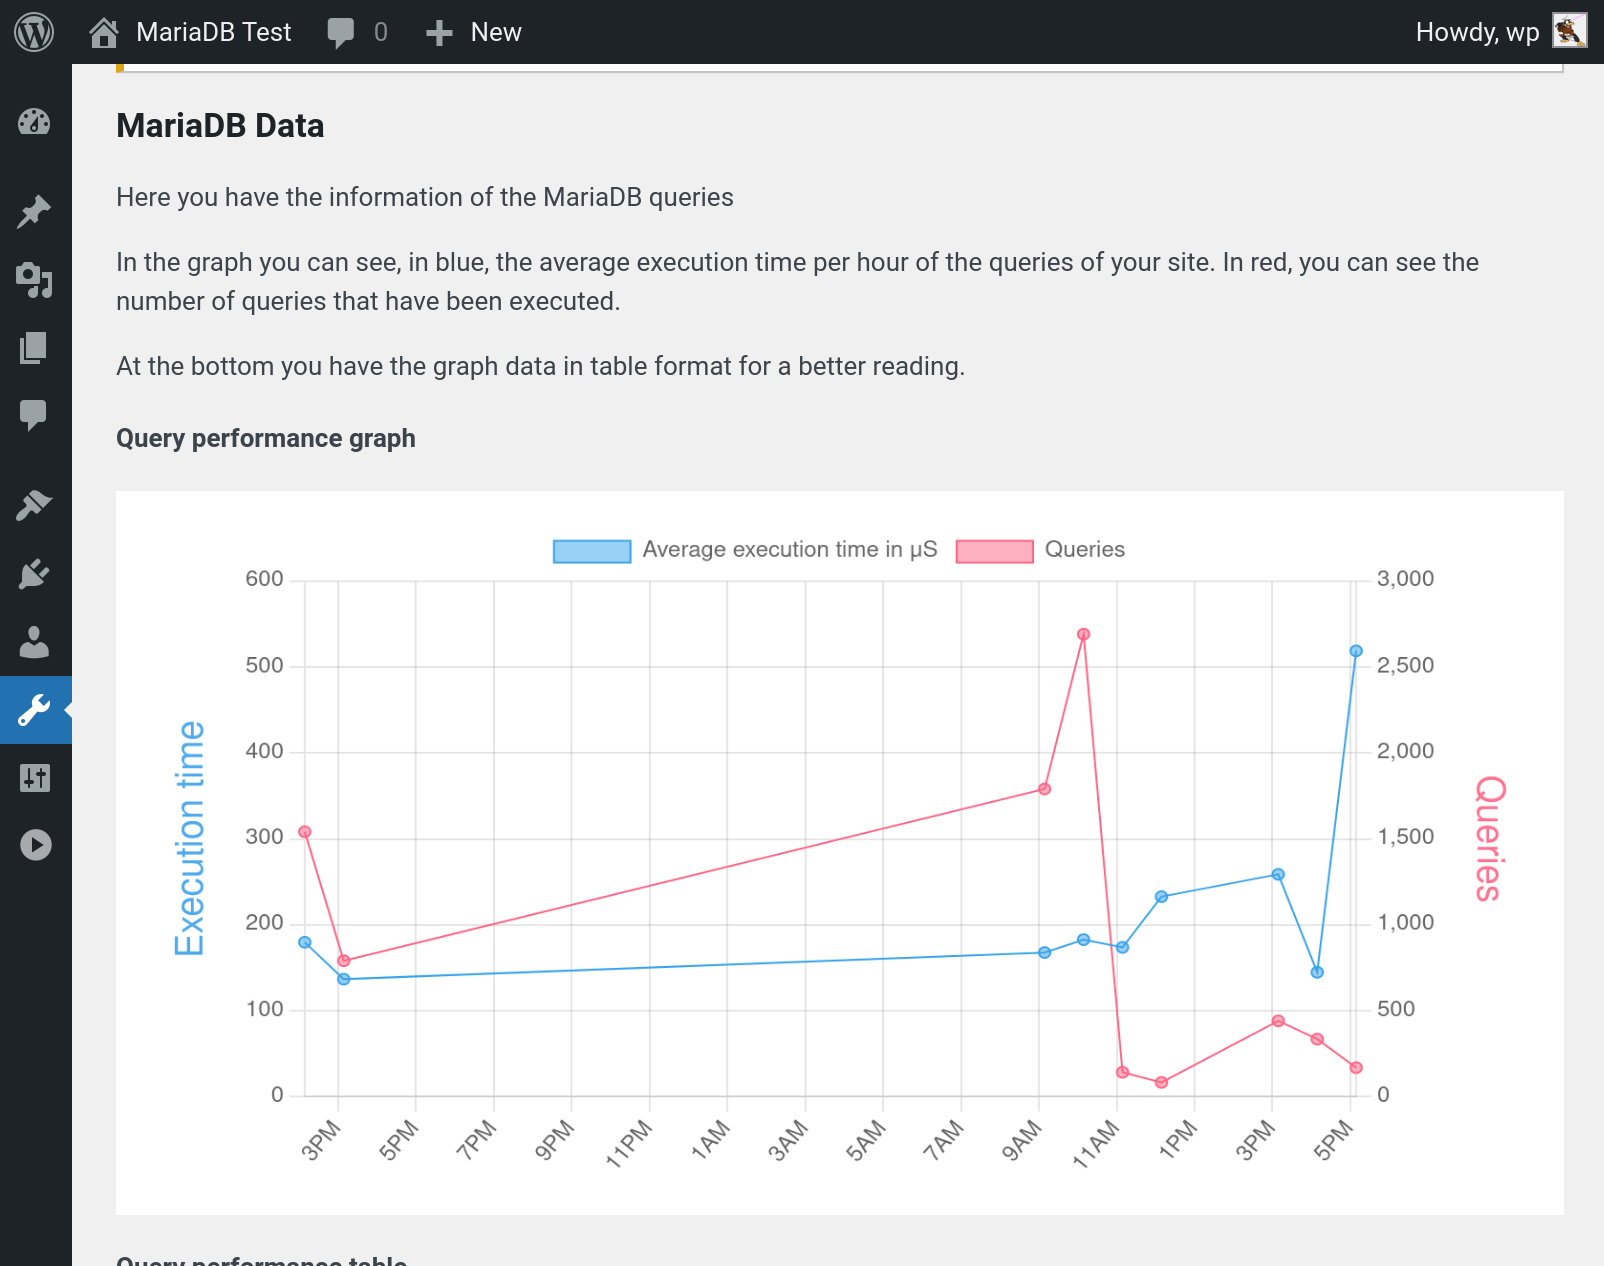
The data for this chart is stored in a new table which is automatically pruned daily. The raw data is shown in a table below the chart to make it easier to consume. There is also an option to change the graph’s contrast to help with visual impairment.
End-of-life checks
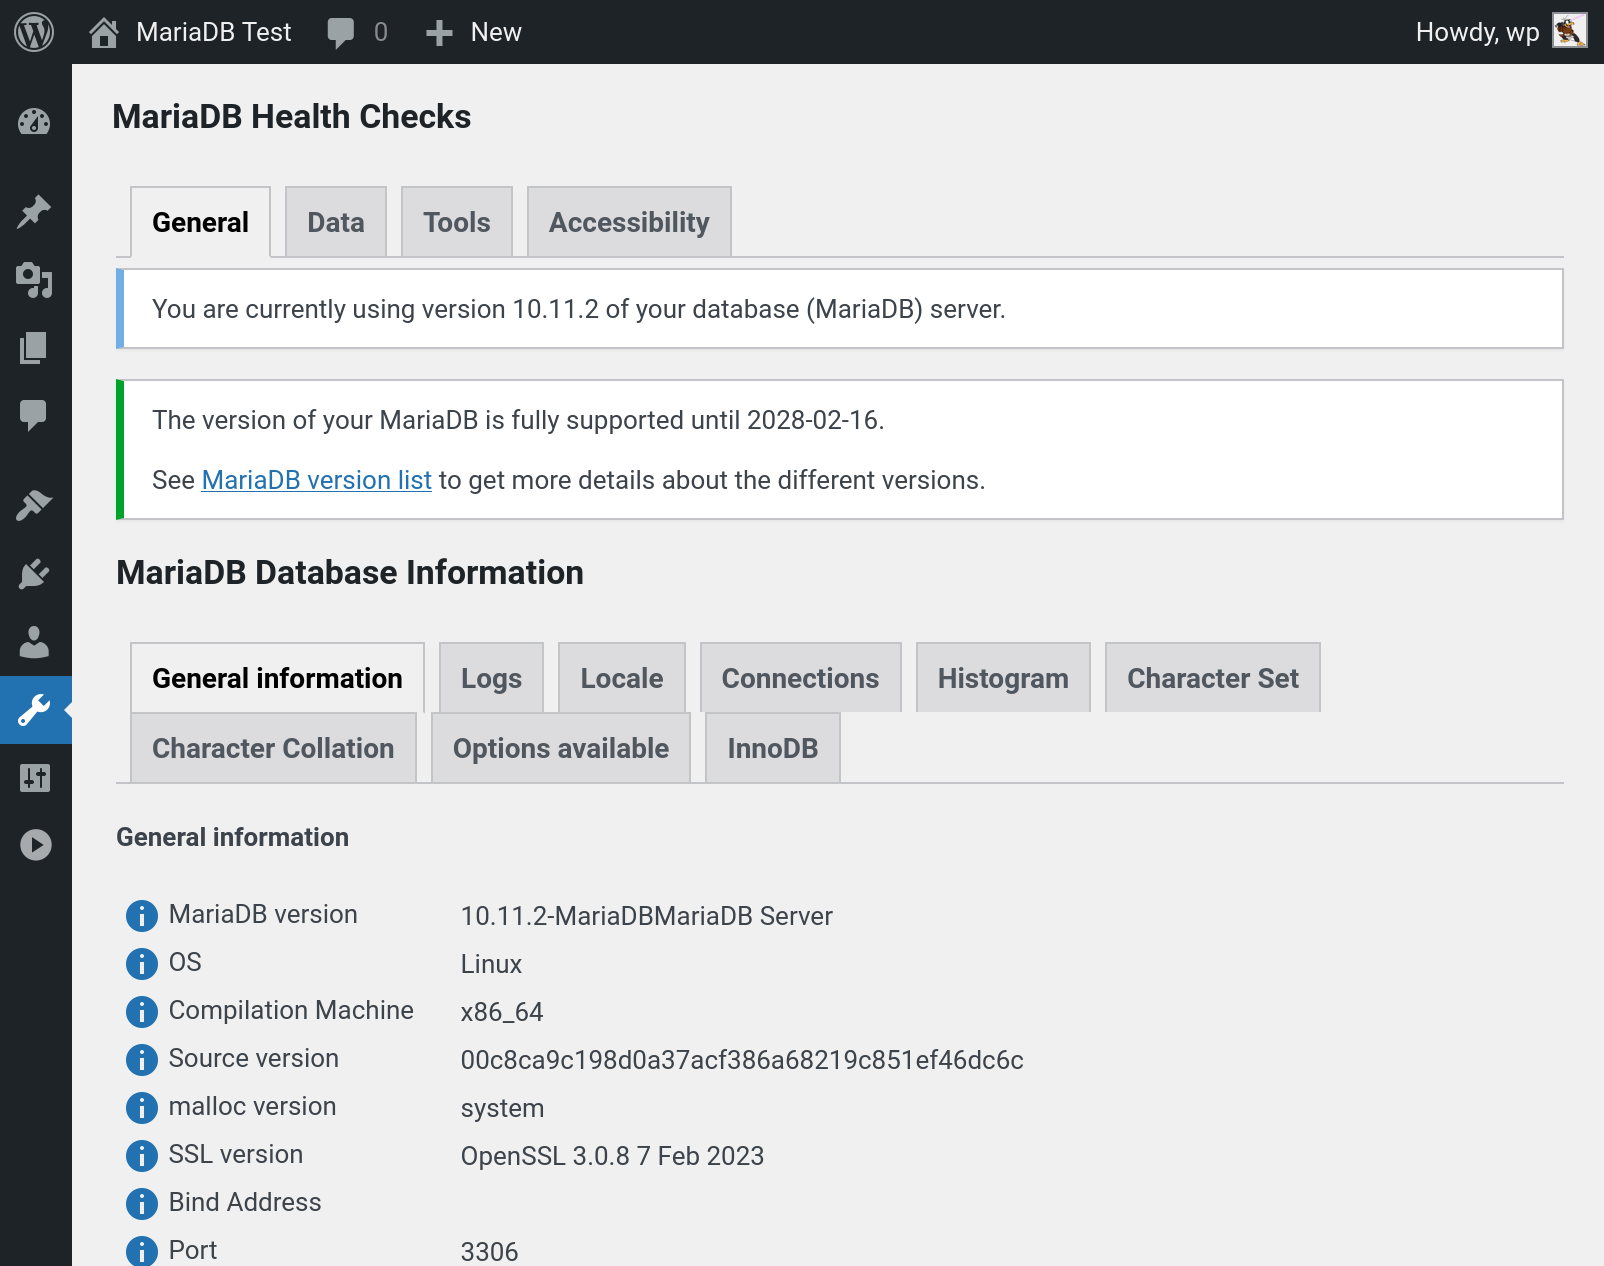
Another features is the end-of-life checks for MariaDB. The plugin contains knows when each major version of MariaDB is no longer supported, it will notify you of the date of the version you are using and will warn you when the version you are using is too old.
System variables
I need to give massive thanks to Javier Casares for this feature, he was like a machine developing this and filling in all the details. The plugin will show the system variables for the server, broken up into categories. Each variable has a tooltip which will describe what the variable is. To cap it all off, Javier also translated it all into Spanish! You can see these in the screenshot above too.
Tools
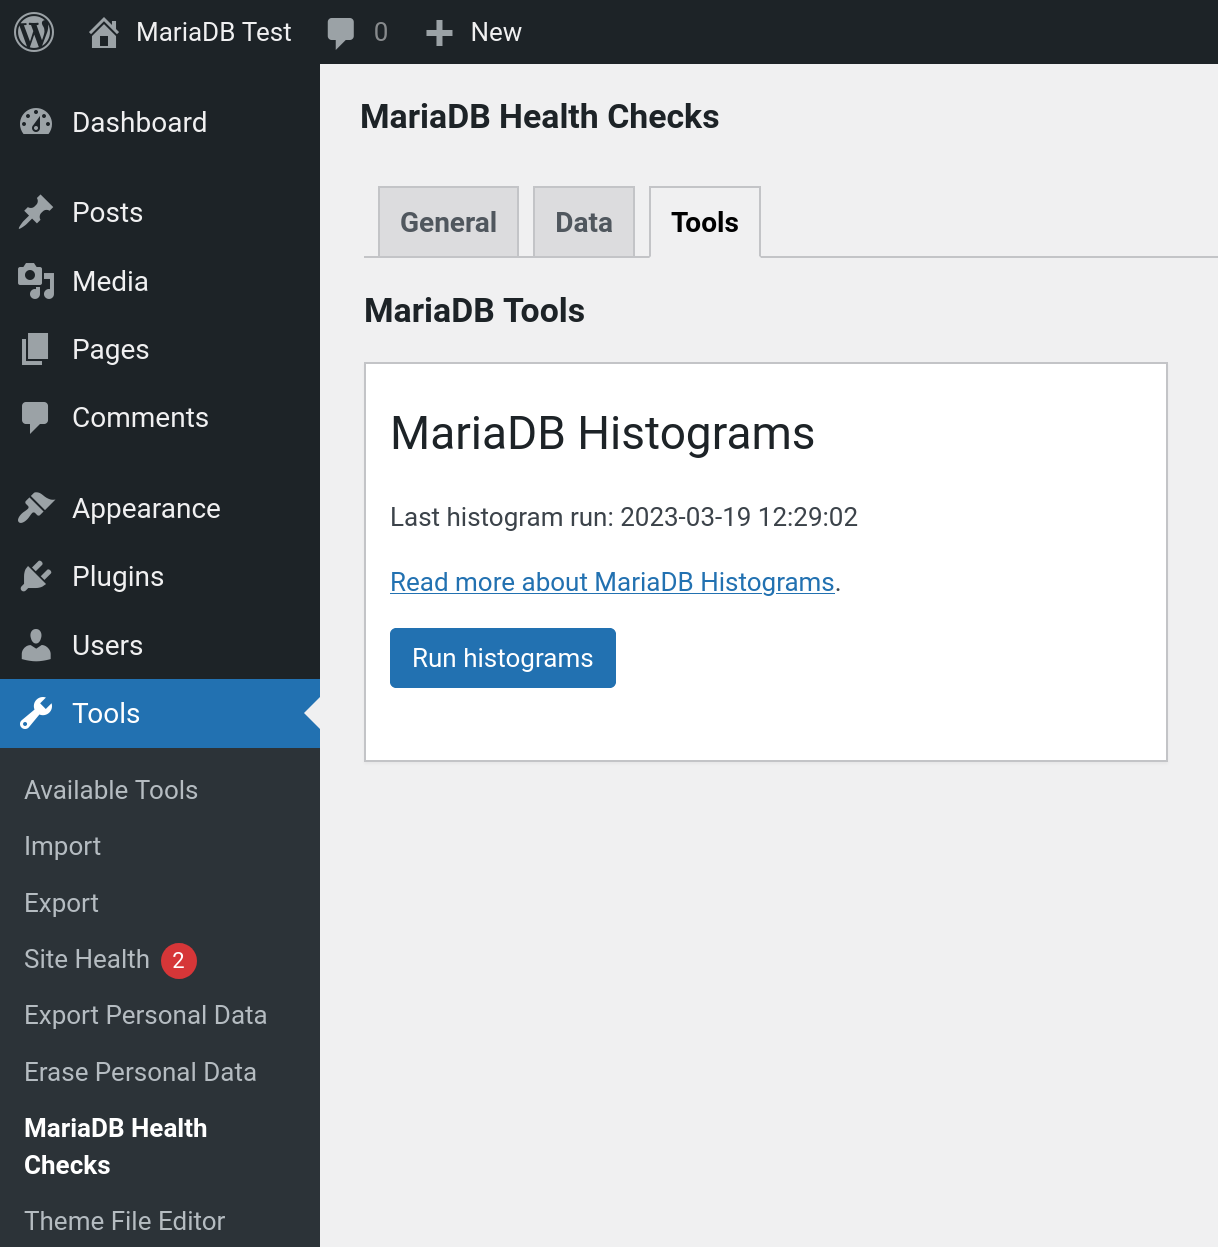
One of the things I specified as part of the Hackathon is that the plugin had to have the ability for administrators to execute things at the touch of a button that will be useful to them. The obvious example for this is “histograms”, especially after the blog post I wrote about them. So, the Hackathon team added this first. At a push of a button in the “Tools” page the command to calculate histograms is run on your WordPress tables. The date they are last run is also shown so that you know when it is time to run them again.
Site Health
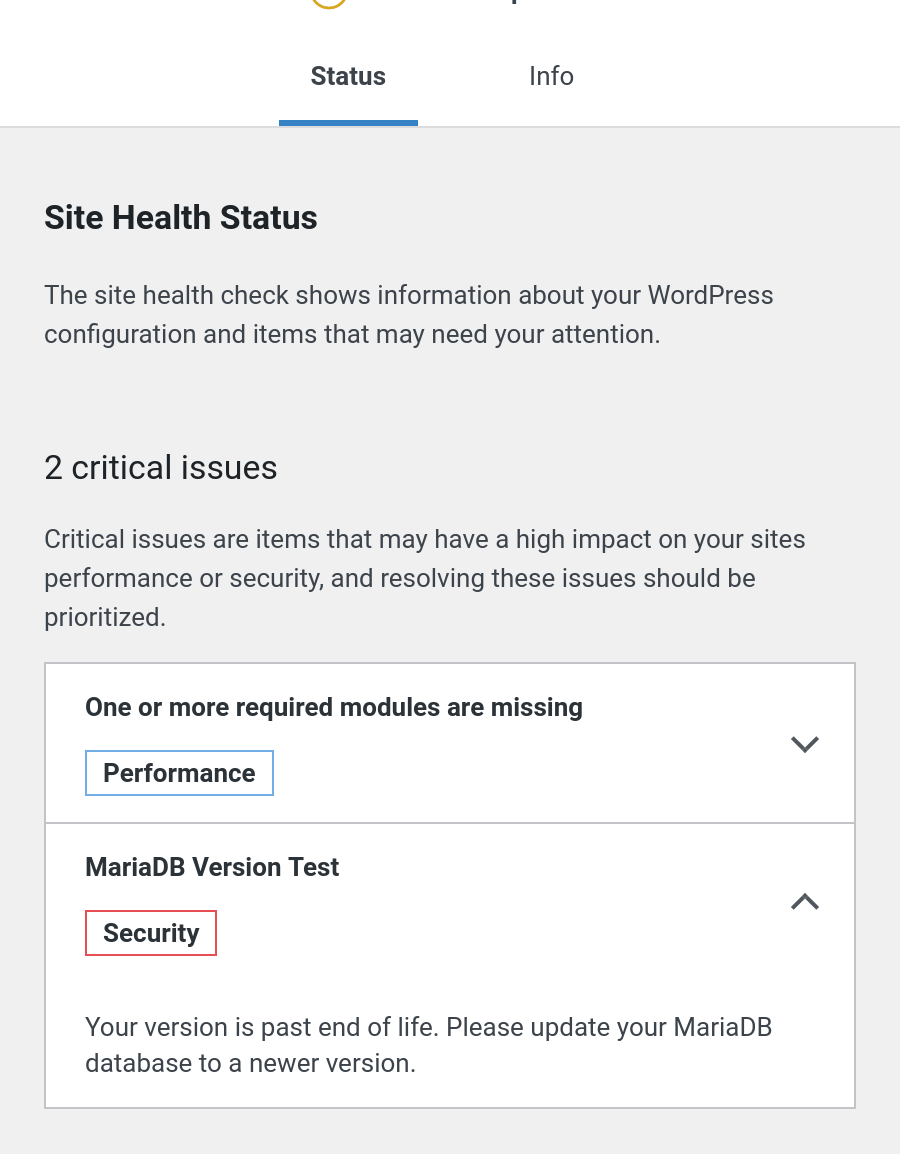
In addition to having its own Tools menu option in WordPress, the plugin integrates with Site Health. There are two checks added to Site Health. The first is the end-of-life check and the second is whether or not Histograms have been run. As with other parts of the plugin, as more features are added we can easily add more checks in here too.
The future
We want to make this tool more useful to administrators of WordPress, and we are listening to the WordPress community so that we can find out what useful additions can be made. We have a few ideas ourselves and I will be at WordCamp Europe 2023 to find out how we can help. If you have any suggestions, please visit the GitHub page and file an issue.
In the mean time you can find the plugin in the WordPress plugin directory.