Meaningful Response Metrics

There was a recent request by Eric Herman, the Chairperson of the MariaDB Foundation board, to add the time to first meaningful response for pull requests to the quarterly contributor metrics I generate and blog about. I thought this was a really good idea. There are a few problems with this, the first being the definition of “meaningful response”.
Meaningful Response
A “meaningful response” would likely be a response that adds value and shows that the pull request is being reviewed. The most accurate way to do this would be to manually record this using a set of criteria that defines what kind of responses are meaningful. This very quickly becomes a complex manual process, which we do not have the resources for. We need a more automated way.
I suggested that, at least for an initial version of this, we record the time between the first pull request opening and the first comment by someone who is member of the MariaDB team in GitHub (but not the author of the pull request). Whilst this isn’t guaranteed to be a meaningful response, there is a high probability of this.
Actual Development
It was decided to add the code to do this to our regular pull request metrics code, as it already talks to GitHub to get week-by-week reports.
Whilst developing support for this in the pull request metrics code, a few issues were hit:
- Code review comments do not count as comments in GitHub API.
- Not all pull requests have comments before they are closed or merged.
- Draft pull requests are very unlikely to have meaningful comments.
- Otto (a previous CEO of the MariaDB Foundation) is a member of the MariaDB team, but most of his comments would not fall under the same classification of a MariaDB plc / MariaDB Foundation review.
- The current method of avoiding hitting the GitHub rate limit makes things incredibly slow.
One by one these were resolved in various ways. First of all, the pull requests reviews actually used a completely different API call to comments. When GitHub’s UI renders the timeline for a pull request, it appears to merge the two calls. This was easy enough to solve, the extra API call was added and the code figures out whether a meaningful response comes via a comment or review first.
As for the pull requests that are not commented on before closing or merging, I added two counters. The first counts the pull requests that the original author closed before there was any comment. In reality this typically happens when a user has created a pull request incorrectly, such as against the wrong version, or they found that the code was not required and needed to be implemented in a different way.
An additional counter was added which counts the pull requests that have been merged by the author (a MariaDB team member) without any comment or review from another member. Now, there could be several reasons for this, such as it being an emergency fix for something or the review happened outside of GitHub. Either way, we should really be handling these things differently. So, they are a metric to show where we could be improving processes.
On to draft pull requests. These are typically pull requests that are there to show a work in progress to someone else or to run a work in progress against the CI system to make sure that everything passes correctly. Drafts are now counted in the metrics and for the meaningful response metrics these are not counted.
As mentioned in the list, Otto Kekäläinen, who was a previous CEO of the MariaDB Foundation, is a MariaDB team member in GitHub. He does a lot of useful work for MariaDB Server still, on behalf of Amazon. For the criteria we are giving he should probably not be included. There was a list of users to exclude added for this.
GitHub’s rate limiting is a little odd. Searches are limited to 30 in a 60 second period. Other API calls have larger limits. To avoid hitting limits we were pausing for 2 seconds between each call. Which was fine prior to these changes as we were just doing several searches per week. Now that we are diving into most pull requests, this added lots of unnecessary delay. To resolve this the remaining rate limit is monitored and when it is detected to be low, the system pauses for 30 seconds. This typically results in only one or two 30 second pauses in a 6 month period.
New Metrics
The new section of the script works like this:
First, get a list of all the MariaDB team members and filter out Otto. The downside of this is that anyone who has left MariaDB will no longer be listed as a team member and this may skew the metrics. Also someone who has commented on pull requests before may be hired by MariaDB plc or Foundation. This would also skew the stats. But this is good enough for now.
Next the standard pull request searches happen, with an additional search to count the number of draft pull requests. All these searches are grouped by weeks.
Now the real new things happen. A list of all open non-draft pull requests for that week are generated. Each one is searched for comments and reviews. A decision is then made as follows:
- If the pull request has a comment or review by a MariaDB team member who is not the author, count the number of days between that and the ticket opening, add this to a total for the week and increment the meaningful response counter (for averages).
- If the pull request was opened and closed by the same user and there were no comments or reviews by a MariaDB team member, a self-closed counter is incremented.
- If the pull request was opened and merged by the same user and there were no comments or reviews by any other MariaDB team member, a self-merged counted is incremented.
- If none of the above criteria match, the no-meaningful-response counter is incremented.
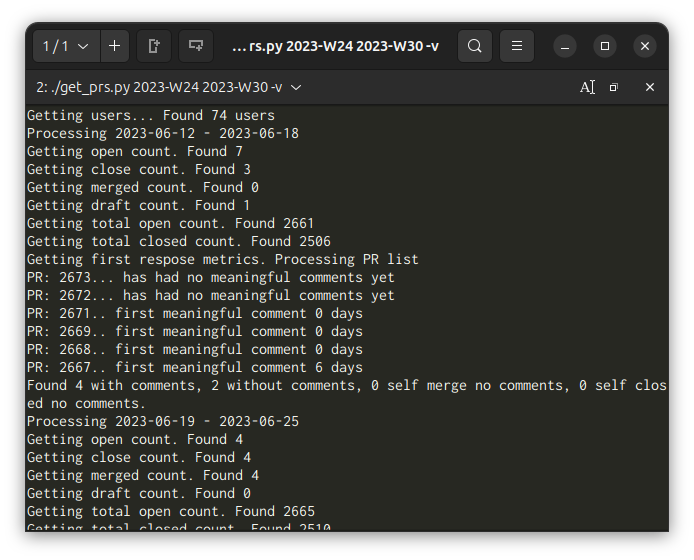
There is also a new --verbose mode to the code so that you can see the decision made for each individual pull request.

Sample Output
With all that said, here is a sample output of a few weeks of data, the raw data is in CSV format but I’ve converted it to a table here for easier viewing.
| Week Ending | 2023-06-18 | 2023-06-25 | 2023-07-02 | 2023-07-09 |
| New PRs | 7 | 4 | 5 | 6 |
| Draft PRs | 1 | 0 | 0 | 0 |
| Closed PRs | 3 | 0 | 4 | 1 |
| Merged PRs | 0 | 4 | 0 | 5 |
| Total PRs | 2661 | 2665 | 2670 | 2676 |
| Still Open PRs | 155 | 155 | 156 | 156 |
| Days to First Response | 1.5 | 10 | 0.3 | 1 |
| New PRs Responded | 4 | 3 | 3 | 3 |
| New PRs Not Responded | 2 | 1 | 1 | 3 |
| PRs Self Merge No Review | 0 | 0 | 1 | 0 |
| PRs Self Closed No Review | 0 | 0 | 0 | 0 |
To expand on the row names, we have:
- New PRs: The number of PRs that have been opened that week.
- Draft PRs: Of the newly opened PRs that week, how many are currently drafts.
- Closed PRs: The number of PRs that have been closed that week (not merged).
- Merged PRs: The number of PRs that have been merged that week.
- Total PRs: The total number of PRs we have had up to the end of that week.
- Still Open PRs: The total number of PRs still open (including draft) at the end of that week.
- Days to First Response: The average number of days to first meaningful response of PRs for PRs that have been responded, for the PRs opened that week.
- New PRs Responded: The total number of PRs that have had a meaningful response that have been opened that week.
- PRs Self Merge No Review: The number of PRs opened that week which have been merged by the author with no review from anyone else in the MariaDB team.
- PRs Self Closed No Review: The number of PRs opened that week which have had no meaningful response and have been closed by the author.
You’ll notice that in the “PRs Self Merge No Review” category that we have one entry. According to verbose mode this is PR #2678. Now, this may well have actually been reviewed by someone outside of GitHub, but there was no comment to indicate this.
Our hope is that collecting these metrics will show where we need to be focusing on things such as process improvements. A full report with this data will be generated in the new quarterly metrics report.
Future Metrics
After discussing things with Ian Gilfillan at the MariaDB Foundation, we have decided to add reports to the PR metrics code. These reports will give us a list of the PRs that require attention the most, in the hope that we can start tackling some of the worst of the backlog. This feature can be tracked in MDBF-576 on Jira.
Beyond this, we are open to ideas. What metrics would you like to see? Could we do any of this better? Let us know what you think.
Featured Image: XKCD Data Trap, used under a Creative Commons Attribution-NonCommercial 2.5 License.