
SHOW ANALYZE
If you ever had to do query performance troubleshooting with MariaDB, you should be familiar with MariaDB’s ANALYZE for statements feature. It does what EXPLAIN ANALYZE does in some other database systems: ANALYZE query runs the query and produces EXPLAIN output, amended with the data from the query execution:
ANALYZE SELECT *
FROM orders, customer
WHERE
  customer.c_custkey = orders.o_custkey AND
  customer.c_acctbal < 0 AND
  orders.o_totalprice > 200*1000
+----+-------------+----------+------+---------------+-------------+---------+--------------------+--------+--------+----------+------------+-------------+
| id | select_type | table    | type | possible_keys | key         | key_len | ref                | rows   | r_rows | filtered | r_filtered | Extra       |
+----+-------------+----------+------+---------------+-------------+---------+--------------------+--------+--------+----------+------------+-------------+
|  1 | SIMPLE      | customer | ALL  | PRIMARY,...   | NULL        | NULL    | NULL               | 149095 | 150000 |    18.08 |       9.13 | Using where |
|  1 | SIMPLE      | orders   | ref  | i_o_custkey   | i_o_custkey | 5       | customer.c_custkey |      7 |     10 |   100.00 |      30.03 | Using where |
+----+-------------+----------+------+---------------+-------------+---------+--------------------+--------+--------+----------+------------+-------------+
There is also the ANALYZE FORMAT=JSON variant which provides much more information: it produces EXPLAIN FORMAT=JSON output, amended with observed runtime statistics. The statistics fields start with “r_”:
- “r_loops” shows how many times each query plan element was executed
- “r_rows” shows how many rows it has produced, on average
- “r_total_time_ms” shows how much time each query plan element took
We at MariaDB have used ANALYZE FORMAT=JSON for diagnosing query optimizer
issues and it has proven to be tremendously useful. But at some point, we
hit an interesting roadblock. The queries we were analyzing were getting
larger and larger, and eventually query performance complaints were about
page-long queries that never finish.
And since the query never finishes, you can’t get ANALYZE [FORMAT=JSON]
output for it.
MariaDB has the SHOW EXPLAIN command. It shows the EXPLAIN of a currently running query. So we’ve decided to join these commands together and introduced the SHOW ANALYZE command. The syntax of the new command is:
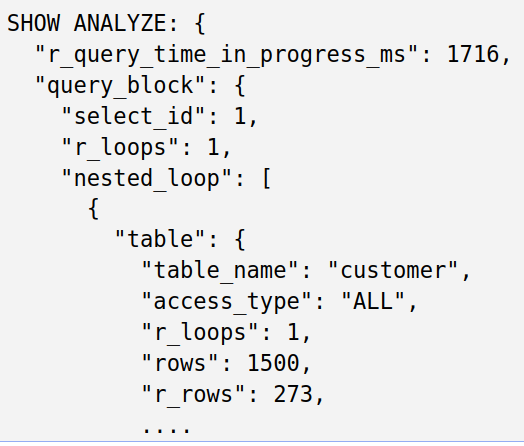
SHOW ANALYZE [FORMAT=JSON] FOR <connection_id>;For the FORMAT=JSON variant, the output is similar to ANALYZE [FORMAT=JSON] output. The r_ members show the statistics of execution that has happened so far. There is one extra member, r_query_time_in_progress_ms which shows how long the query has been running:
MariaDB [test]> show analyze format=json for 4\G
*************************** 1. row ***************************
SHOW ANALYZE: {
  "r_query_time_in_progress_ms": 1716,
  "query_block": {
    "select_id": 1,
    "r_loops": 1,
    "nested_loop": [
      {
        "table": {
          "table_name": "customer",
          "access_type": "ALL",
          "r_loops": 1,
          "rows": 1500,
          "r_rows": 273,
          ....
The presence of other r_* members depends on whether the executor is collecting
timing information for the target query or not.
If the target query is an ANALYZE query, the executor will collect timing
information for it (this incurs some extra CPU overhead). Then, SHOW ANALYZE FORMAT=JSON
will show r_*time_ms members.
If the target query is a regular query (a SELECT, UPDATE, DELETE, etc), then
the executor will not collect timing information, and SHOW ANALYZE FORMAT=JSON will
only show counter-based statistics, like r_loops, r_rows, and r_filtered.
The JIRA task for this is MDEV-27021 and the
preview is available here
EXPLAIN FOR CONNECTION
Both MariaDB and MySQL have the capability to examine the query plan of a running query. MariaDB was first to introduce this feature and it uses this syntax:
EXPLAIN [FORMAT=JSON|...] FOR CONNECTION <connection_id>;Note that MySQL allows one to produce JSON output, which has more details. There were multiple requests from the community to add support for MySQL’s syntax to MariaDB. We did that and added support for producing FORMAT=JSON output. Now, in the 10.9 preview release, one can use either form of syntax:
SHOW EXPLAIN [FORMAT=JSON] FOR <connection_id>;
EXPLAIN [FORMAT=JSON] FOR CONNECTION <connection_id>;
The JIRA task for this is MDEV-10000. Download the preview release here.